Putting at test how portable OpenTelemetry really is
This post was originally published on my Substack - Backend Engineering Adventures.
I posted a little while ago on how to set up OTel in Python and send data to Honeycomb. I love Honeycomb, but my requirements for observability tooling on personal projects changed - I wanted to self-host because I had more services to plug in and didn’t want to pay a service subscription (because this is all my playground).
So I decided to give Grafana a shot. Good for learning purposes since I’d never used it extensively. I deployed the stack (Loki, Prometheus, Tempo, Grafana) on Railway, along with an OTEL Collector, to serve as the central hub. Initially, I used this template, but I ended up creating my own because the first one didn’t include the OTel Collector. I can explore more about how I did it!
So, was it easy to port things over?
Yes. Surprisingly so.
The application code? Untouched. The only change was swapping one environment variable:
# Before (Honeycomb)
OTEL_EXPORTER_OTLP_ENDPOINT=https://api.honeycomb.io

# After (Self-hosted)
OTEL_EXPORTER_OTLP_ENDPOINT=http://opentelemetry-collector-contrib.railway.internal:4318
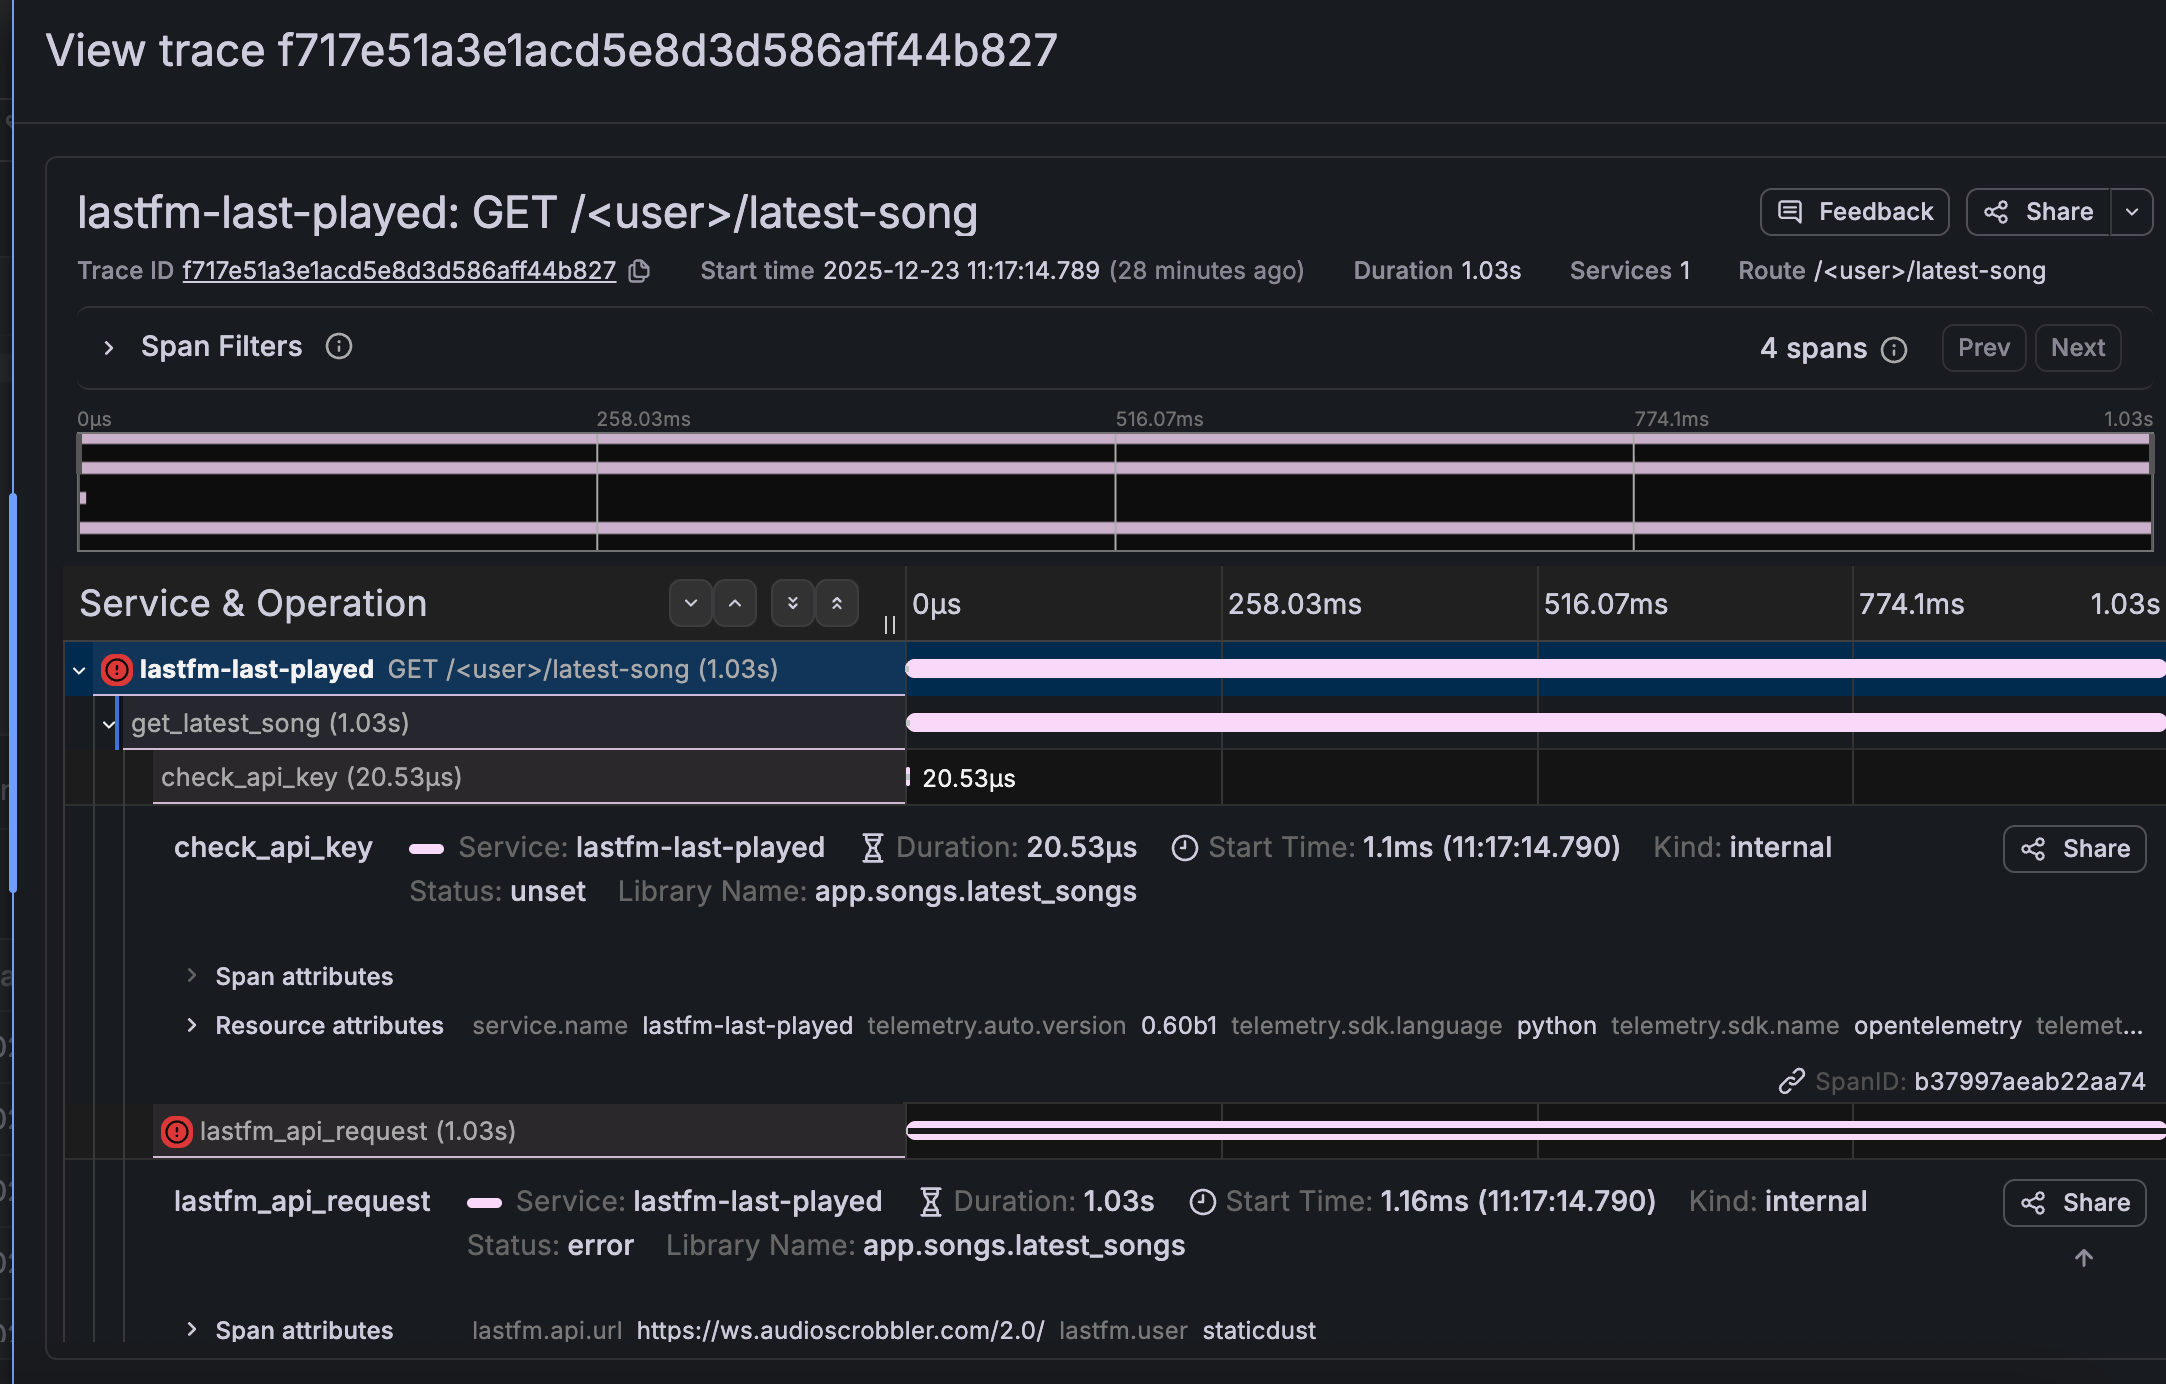
That’s it. The opentelemetry-instrument auto-instrumentation kept working exactly as before. Traces and metrics started flowing to Tempo and Prometheus immediately.
Where I actually struggled
The migration itself was smooth. What tripped me up was properly configuring the Grafana stack and correctly setting up the OTEL Collector endpoints.
Once I fixed those, everything worked. No application changes needed.
The verdict
OpenTelemetry delivered on its portability promise. Switching from Honeycomb to a self-hosted stack required exactly one environment variable change and zero modifications to my instrumentation code.
The only gotcha is that auto-instrumentation doesn’t capture logs - you’ll need a few lines of manual configuration for that, regardless of your backend. So I did that, and bam - log lines now exist on Loki and can be seen on my Grafana dashboard! Here is the link to check the code.
Will it always be easy to switch providers, even in a big company?
No, it won’t.
I started sending data to the new provider, but if there are alerts, dashboards, notification channels, users, and teams set up, all of those follow each stack’s syntax and format. Depending on your company size, this is likely where the pain will lie.
Lit! I want this!
If you want to spin up your own Grafana observability stack on Railway, I’ve open-sourced my setup: railway-grafana-stack. It includes the OTEL Collector, Tempo, Loki, Prometheus, and Grafana - all pre-configured to work together. In another post, I can talk about how I manage to spin all of them in a private network and connect to my Grafana dashboard on my own machine - no public endpoints involved!